class: bottom, left, title-slide .title[ # Algorithmic Microtargeting? ] .subtitle[ ## How ad delivery algorithms influence distribution of political ads ] .author[ ### <b>Fabio Votta</b>, Tom Dobber, Natali Helberger, and Claes de Vreese <i>(University of Amsterdam)</i>, Benjamin Guinaudeau <i>(University of Konstanz)</i> ] .date[ ### favstats.github.io/algomicro/epsa2023 (Slides) <br> <svg viewBox="0 0 512 512" style="height:1em;position:relative;display:inline-block;top:.1em;fill:blue;" xmlns="http://www.w3.org/2000/svg"> <path d="M459.37 151.716c.325 4.548.325 9.097.325 13.645 0 138.72-105.583 298.558-298.558 298.558-59.452 0-114.68-17.219-161.137-47.106 8.447.974 16.568 1.299 25.34 1.299 49.055 0 94.213-16.568 130.274-44.832-46.132-.975-84.792-31.188-98.112-72.772 6.498.974 12.995 1.624 19.818 1.624 9.421 0 18.843-1.3 27.614-3.573-48.081-9.747-84.143-51.98-84.143-102.985v-1.299c13.969 7.797 30.214 12.67 47.431 13.319-28.264-18.843-46.781-51.005-46.781-87.391 0-19.492 5.197-37.36 14.294-52.954 51.655 63.675 129.3 105.258 216.365 109.807-1.624-7.797-2.599-15.918-2.599-24.04 0-57.828 46.782-104.934 104.934-104.934 30.213 0 57.502 12.67 76.67 33.137 23.715-4.548 46.456-13.32 66.599-25.34-7.798 24.366-24.366 44.833-46.132 57.827 21.117-2.273 41.584-8.122 60.426-16.243-14.292 20.791-32.161 39.308-52.628 54.253z"></path></svg> <span class="citation">@favstats</span> <br> <svg viewBox="0 0 448 512" style="height:1em;position:relative;display:inline-block;top:.1em;fill:#615ff7;" xmlns="http://www.w3.org/2000/svg"> <path d="M433 179.11c0-97.2-63.71-125.7-63.71-125.7-62.52-28.7-228.56-28.4-290.48 0 0 0-63.72 28.5-63.72 125.7 0 115.7-6.6 259.4 105.63 289.1 40.51 10.7 75.32 13 103.33 11.4 50.81-2.8 79.32-18.1 79.32-18.1l-1.7-36.9s-36.31 11.4-77.12 10.1c-40.41-1.4-83-4.4-89.63-54a102.54 102.54 0 0 1-.9-13.9c85.63 20.9 158.65 9.1 178.75 6.7 56.12-6.7 105-41.3 111.23-72.9 9.8-49.8 9-121.5 9-121.5zm-75.12 125.2h-46.63v-114.2c0-49.7-64-51.6-64 6.9v62.5h-46.33V197c0-58.5-64-56.6-64-6.9v114.2H90.19c0-122.1-5.2-147.9 18.41-175 25.9-28.9 79.82-30.8 103.83 6.1l11.6 19.5 11.6-19.5c24.11-37.1 78.12-34.8 103.83-6.1 23.71 27.3 18.4 53 18.4 175z"></path></svg> <span class="citation">@favstats</span><span class="citation">@fosstodon.org</span> 24th June 2023 - EPSA 2023 ] --- layout: true <div class="logo"></div> --- ### Online Political Microtargeting of Political Ads - the "bad actors"-story .pull-left[ <img src="img/cambridge_analytica.png" width="100%"> ] --- ### Online Political Microtargeting of Political Ads - the "bad actors"-story .pull-left[ <img src="img/cambridge_analytica.png" width="100%"> *The explicit assumption here that advertisers typically have strong control over who sees which ad* ] -- .pull-right[ **But there is more than *just* targeting criteria that decides who sees political ads:** + advertisers can set targeting *boundaries* + *ad delivery algorithms* "decide" which individual users get ads from which advertiser ] --- class: center, middle, white <!--  --> <img src="img/plantuml00.png" width="80%"> --- class: center, middle, white <!--  --> <img src="img/plantuml01.png" width="80%"> --- class: center, middle, white <!--  --> <img src="img/plantuml02.png" width="80%"> --- class: center, middle, white <!--  --> <img src="img/plantuml04.png" width="80%"> --- class: center, middle, white <!-- 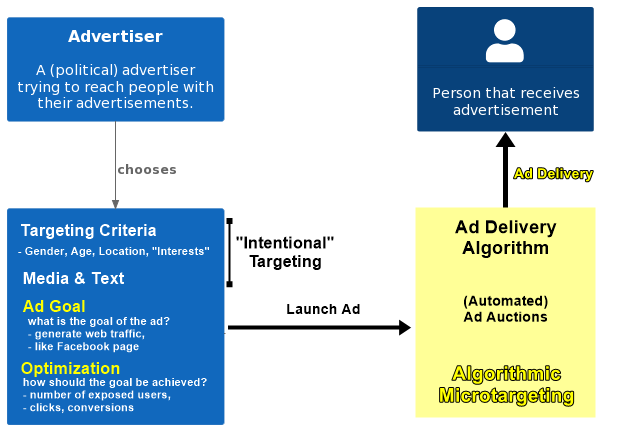 --> <img src="img/plantuml05.png" width="80%"> --- ### Who decides who sees which ad on Meta? + **Ad auctions** = an auction takes place that determines which ad by whom is shown <center> <img src="img/fb-ad-bidding.png" width="65%" height="65%"> </center> --- ### Who decides who sees which ad on Meta? + **Relevance** = how relevant is the ad to the user <img src="img/relevant_quote.png" width="70%" /> [(Meta Business Help Center, 2022)](https://www.facebook.com/business/help/430291176997542) --- ### Who decides who sees which ad on Meta? + **Ad auctions** = an auction takes place that determines which ad by whom is shown: based on *budget* + **Relevance** = how relevant is the ad to the user <center> <img src="img/fb-ad-bidding2.png" width="65%" height="65%"> </center> -- ##### *Ad delivery algorithms* finding *relevant* audiences for ads: we term this **algorithmic microtargeting** --- ### Who decides who sees which ad on Meta? When targeting the same audience, at the same time, with the same budget: + Ad delivery is heavily skewed along gendered and racial stereotypes + even without the intent of the advertiser [(Ali et al., 2020)](https://dl.acm.org/doi/10.1145/3359301) -- Regarding political ads [(Ali et al., 2021)](https://dl.acm.org/doi/pdf/10.1145/3437963.3441801): -- + **Skewed delivery** + Political ads more often delivered to ideologically congruent audience + Bernie ads → higher % D; + Trump ads → higher % R -- + **Increased cost** + Liberal ad to a liberal audience: *21 Dollar per 1000 users*; + Conservative ad delivered to liberal audience: *40 Dollar per 1000 users*. --- class: center, middle ## Research Question ### How does the Meta ad delivery algorithm<br>influence the pricing & distribution of political ads<br>in the Netherlands? --- class: center, middle # Research Design --- ### Research Design + Algorithm audit study + Place the same ads targeting the same audiences (9 different ones) -- + Collaborate with Dutch parties to place political ads + Final collaboration with 3: 1. GroenLinks (Green party) 2. VVD (centre-right party of PM Rutte) 3. PvdA (social democrats) -- + Place ads before nationwide local elections on March 16th 2022 + 1st to 7th February 2022 + Spend 2 Euros a day on 45 ad copies + in total: 630 Euro per party -- + Pre-registered research design and hypotheses --- ### Dependent Variables + Price per 1k users reached + this measure is an industry standard + Ad delivery share + Audience shares measured by % of ads delivered to specific group + "How many people were reached in Audience A vs. Audience B" + Pairwise setup which allows us to observe presence and absence of target audience + e.g. ~60% of audience was interested in politics vs. 40% was not --- ### Within- and between-party comparisons The study design incorporates two *levels of comparisons* <br> Observing differences of **pricing and delivery**: 1. *between parties* + i.e. we expect pricing and delivery to differ by party 1. *within a party* + i.e. we expect pricing and delivery to differ by audience --- ### Ad Relevance We theorize two different levels of (predicted) relevance: -- 1. Relevant audience for party (i.e. source of ad) -- + Ads from an environmentalist party more likely to be relevant for audience interested in environmentalism. <br> -- <ol start="2"> <li>Relevant audience for ad content (e.g. political message)</li> </ol> -- + Political message likely to be relevant for people interested in politics --- ### Hypotheses  [(Meta Business Help Center, 2022)](https://www.facebook.com/business/help/430291176997542) > **H1:** **The more relevant** an audience is for an ad, **the cheaper is the cost** for reaching 1000 users in that audience. > **H2:** **The more relevant** an audience is for an ad, **the more are ads delivered** to that audience. -- We expect that ads by party with a greater share of supporters are less expensive (H3a) and reach more people (H3b) > **H3a:** Parties with a greater share of supporters pay less for reaching 1000 users. > **H3b:** Parties with a greater share of supporters reach more people than smaller parties. --- ### Targeting criteria (Sub-hypotheses for H1 & H2) We used 9 different (paired) targeting criteria for our advertisements .pull-left[ 1. Political interests 2. Excluding political interest <ol start="3"> <li>Higher educated audience</li> <li>Lower educated audience</li> </ol> ] .pull-right[ **Relevant audiences for ad content** > Targeting political ads to **politically interested** and **higher-educated** audiences > *is less expensive* > *deliver more* > than targeting politically uninterested and lower-educated audiences. ] --- ### Targeting criteria (Sub-hypotheses for H1 & H2) We used 9 different (paired) targeting criteria for our advertisements .pull-left[ 1. Political interests 2. Excluding political interest <ol start="3"> <li>Higher educated audience</li> <li>Lower educated audience</li> </ol> <ol start="5"> <li>Environmental interests</li> <li>Excluding environmental interests</li> </ol> <ol start="7"> <li>Economic interests</li> <li>Excluding Economic interests</li> </ol> ] .pull-right[ **Relevant audience for party** > Targeting political ads to issues that party has issue ownership over > *is less expensive* > *delivers more* compared to other parties ] --- ### Targeting criteria (Sub-hypotheses for H1 & H2) We used 9 different (paired) targeting criteria for our advertisements .pull-left[ 1. Political interests 2. Excluding political interest <ol start="3"> <li>Higher educated audience</li> <li>Lower educated audience</li> </ol> <ol start="5"> <li>Environmental interests</li> <li>Excluding environmental interests</li> </ol> <ol start="7"> <li>Economic interests</li> <li>Excluding Economic interests</li> </ol> <ol start="9"> <li>No Targeting</li> </ol> ] --- class: center, middle # Ad Creative and Setup --- ## How the ad looked like on Desktop <img src="img/example_pvda.png" style="float: left; width: 37%; margin-right: 1%; margin-bottom: 0.5em;"> <img src="img/example_gl.png" style="float: left; width: 37%; margin-right: 1%; margin-bottom: 0.5em;"> <p style="clear: both;"> --- ## How the ad looked like on Desktop <img src="img/example_vvd.png" style="float: left; width: 37%; margin-right: 1%; margin-bottom: 0.5em;"> --- class: center, middle ## Results --- class: center, white, middle ### Between-party differences `\(\rightarrow\)` we consistently find one party that pays less and reaches more people --- class: white #### Between-party differences (per individual ad) .font80[PvdA pays the least (**10-12 cents less** or: 9-11%) & reaches more people (~**1.1 - 1.3k more** per ad)] .pull-left[ <img src="epsa2023_files/figure-html/unnamed-chunk-2-1.png" width="504" /> ``` ## # A tibble: 15 × 5 ## party reach share targeting relevance ## <chr> <dbl> <dbl> <chr> <dbl> ## 1 PvdA 13138 52.1 Higher Education 1 ## 2 PvdA 12917 51.7 Higher Education 1 ## 3 GroenLinks 11938 51.7 Higher Education 2 ## 4 VVD 11528 51.6 Higher Education 1 ## 5 VVD 11845 51.6 Higher Education 1 ## 6 GroenLinks 11622 51.6 Higher Education 2 ## 7 PvdA 12860 51.6 Higher Education 1 ## 8 GroenLinks 11727 51.4 Higher Education 2 ## 9 PvdA 12729 51.1 Higher Education 1 ## 10 GroenLinks 11486 51.1 Higher Education 2 ## 11 VVD 11388 51.0 Higher Education 1 ## 12 PvdA 12632 50.9 Higher Education 1 ## 13 GroenLinks 11509 50.9 Higher Education 2 ## 14 VVD 11344 50.8 Higher Education 1 ## 15 VVD 11260 50.6 Higher Education 1 ``` ] -- .pull-right[ <img src="epsa2023_files/figure-html/unnamed-chunk-3-1.png" width="504" /> ] --- class: white #### Between-party differences (per target audience) -- <!-- 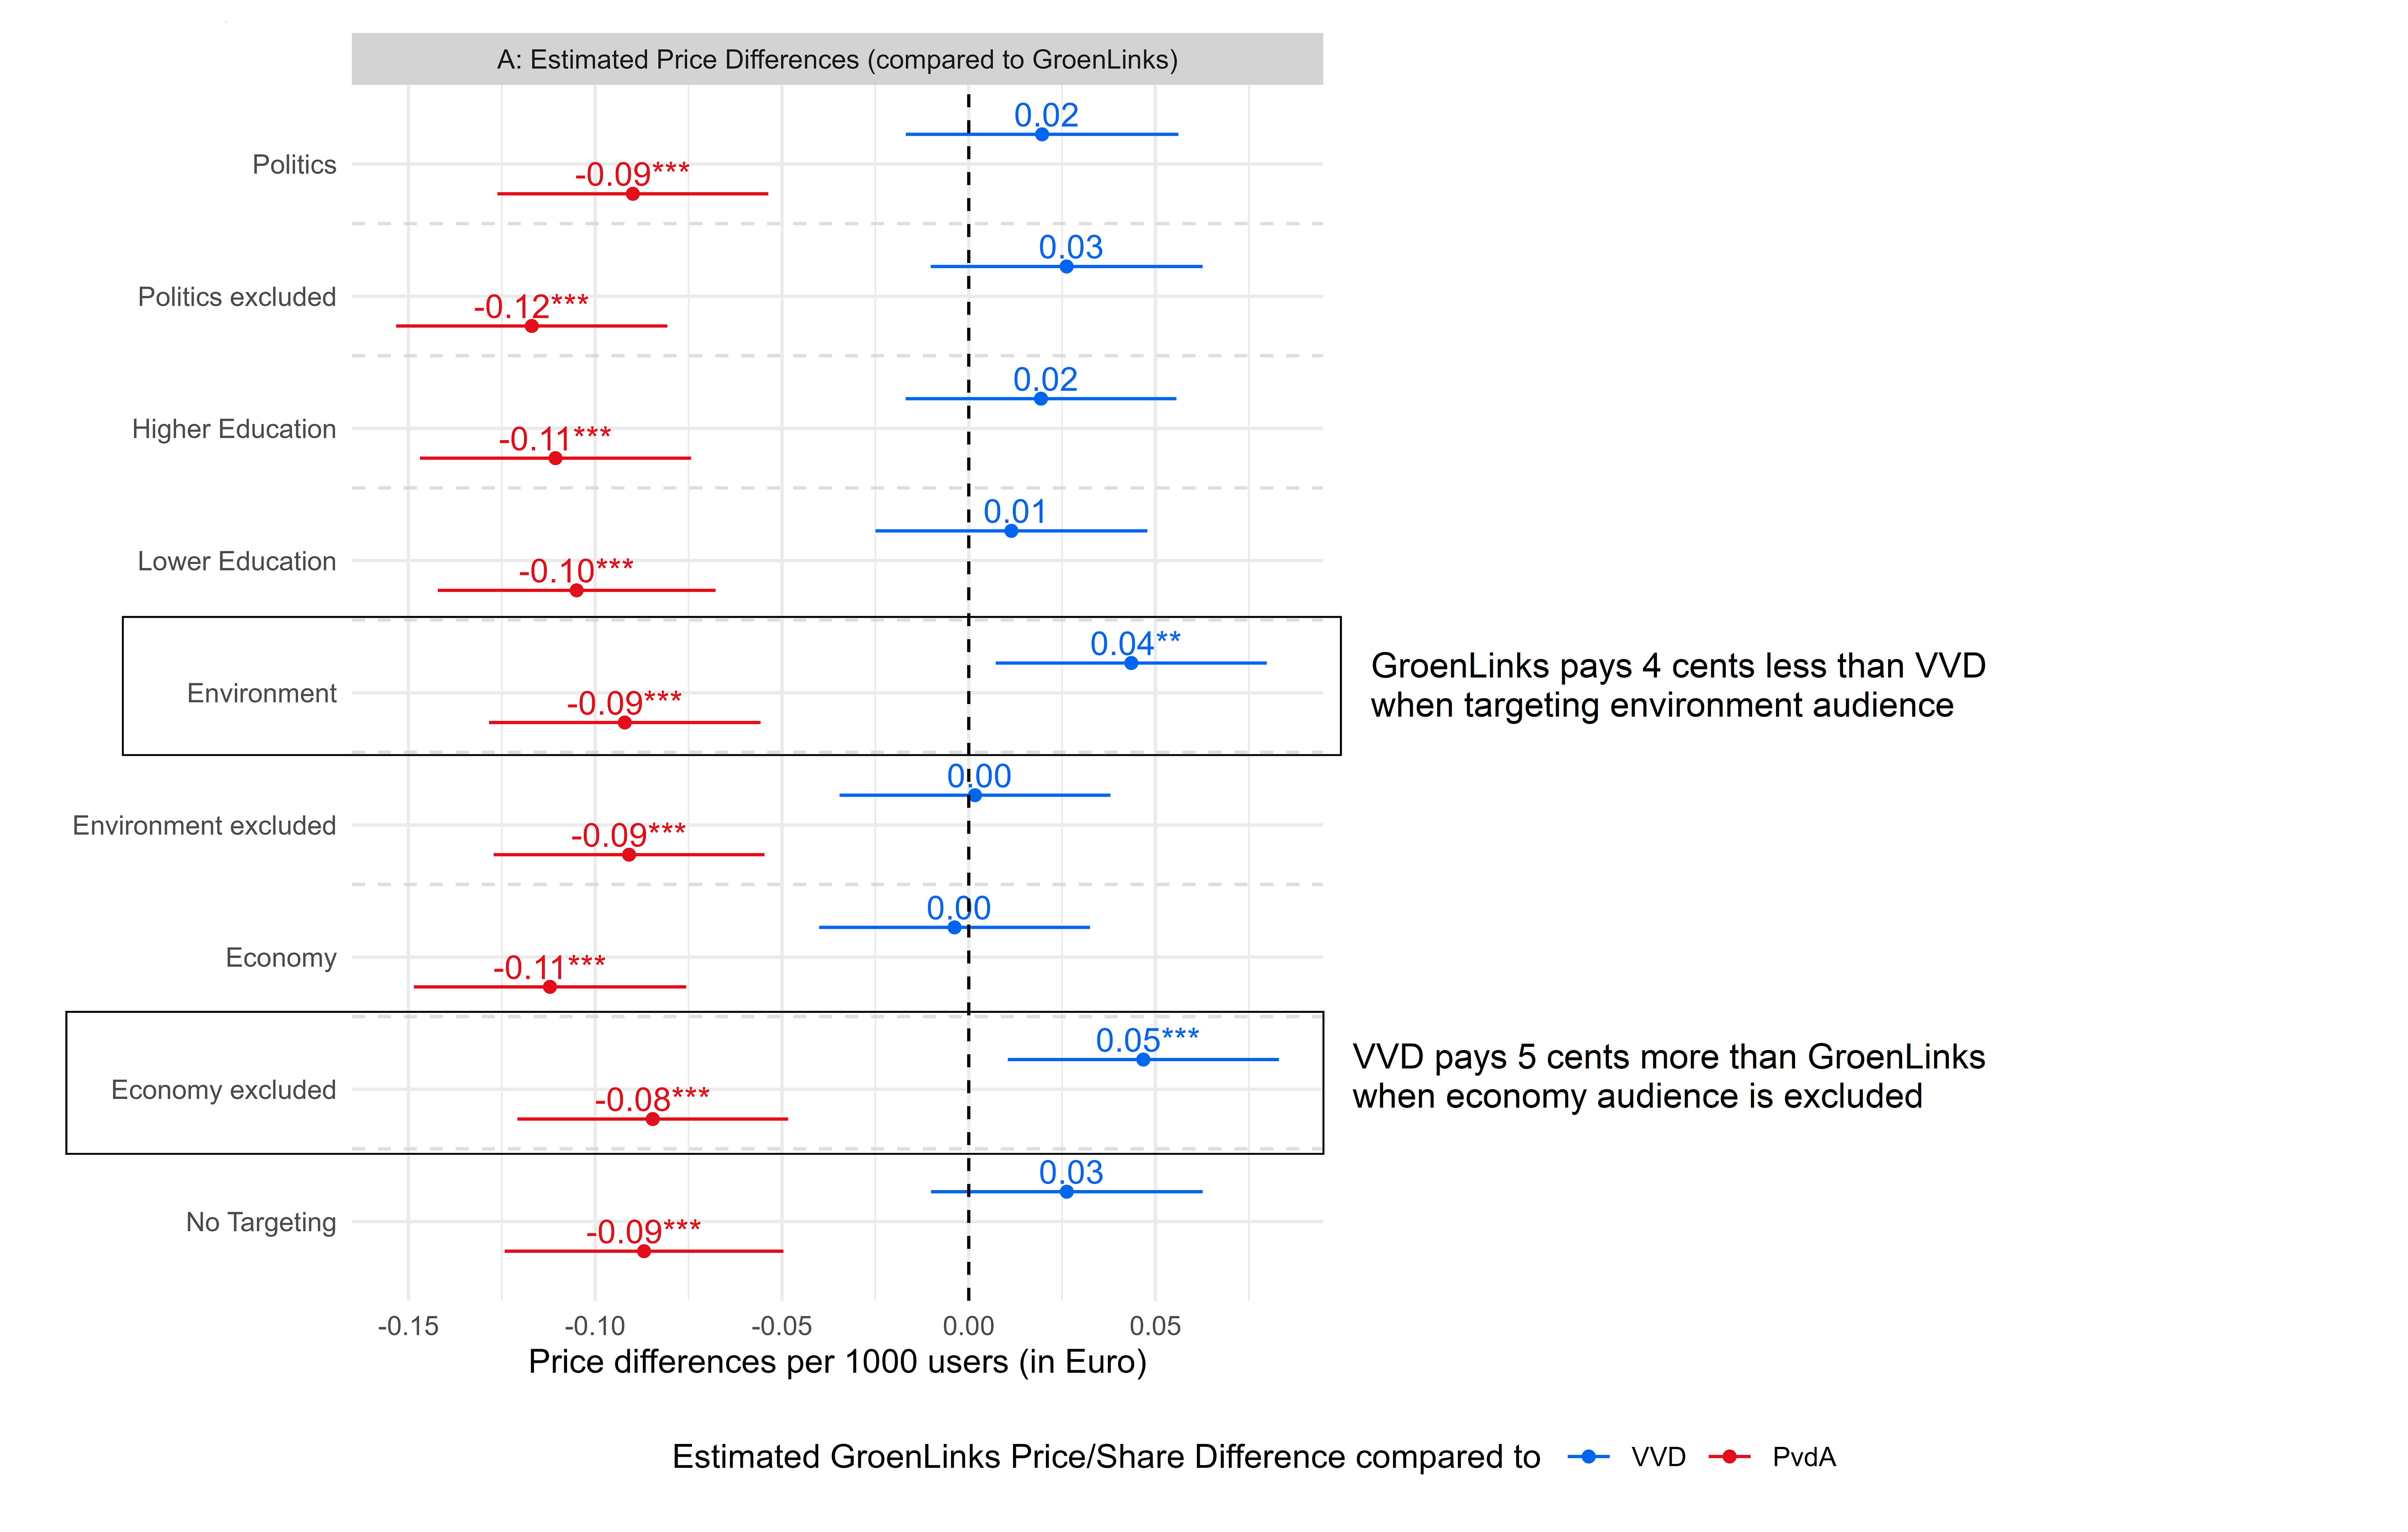 --> <img src="img/diffs_single1.png" width="85%" height="85%"> --- class: white #### Between-party differences (zoomed in) .font80[*Exclude economic interests* or *target environmental interests*:<br>VVD reaches fewer people per ad than GL (**~380-450 fewer people**) and pay more (**4-5 cents more**)] .pull-left[ <img src="epsa2023_files/figure-html/unnamed-chunk-4-1.png" width="504" /> ] .pull-right[ <img src="epsa2023_files/figure-html/unnamed-chunk-7-1.png" width="504" /> ] --- class: center, white, middle ### Within-party differences --- class: white ### Within-party differences Let's compare now: Ad price and ad delivery share of + **higher-educated** vs. **lower-educated** audience + Audience **interested in the economy** vs. **not interested** + Audience **interested in politics** vs. **not interested** + Audience **interested in the environment** vs. **not interested** --- class: white ### Within-party differences - Price per 1k .pull-left[ Ads **cost less for**: + *higher-educated* vs. *lower-educated audience* Ad price **does not statistically differ for**: + Audience *interested in the economy* vs. *not interested* + Audience *interested in politics* vs. *not interested* Ads **cost more for**: + Audience *interested in the environment* vs. *not interested* ] .pull-right[ 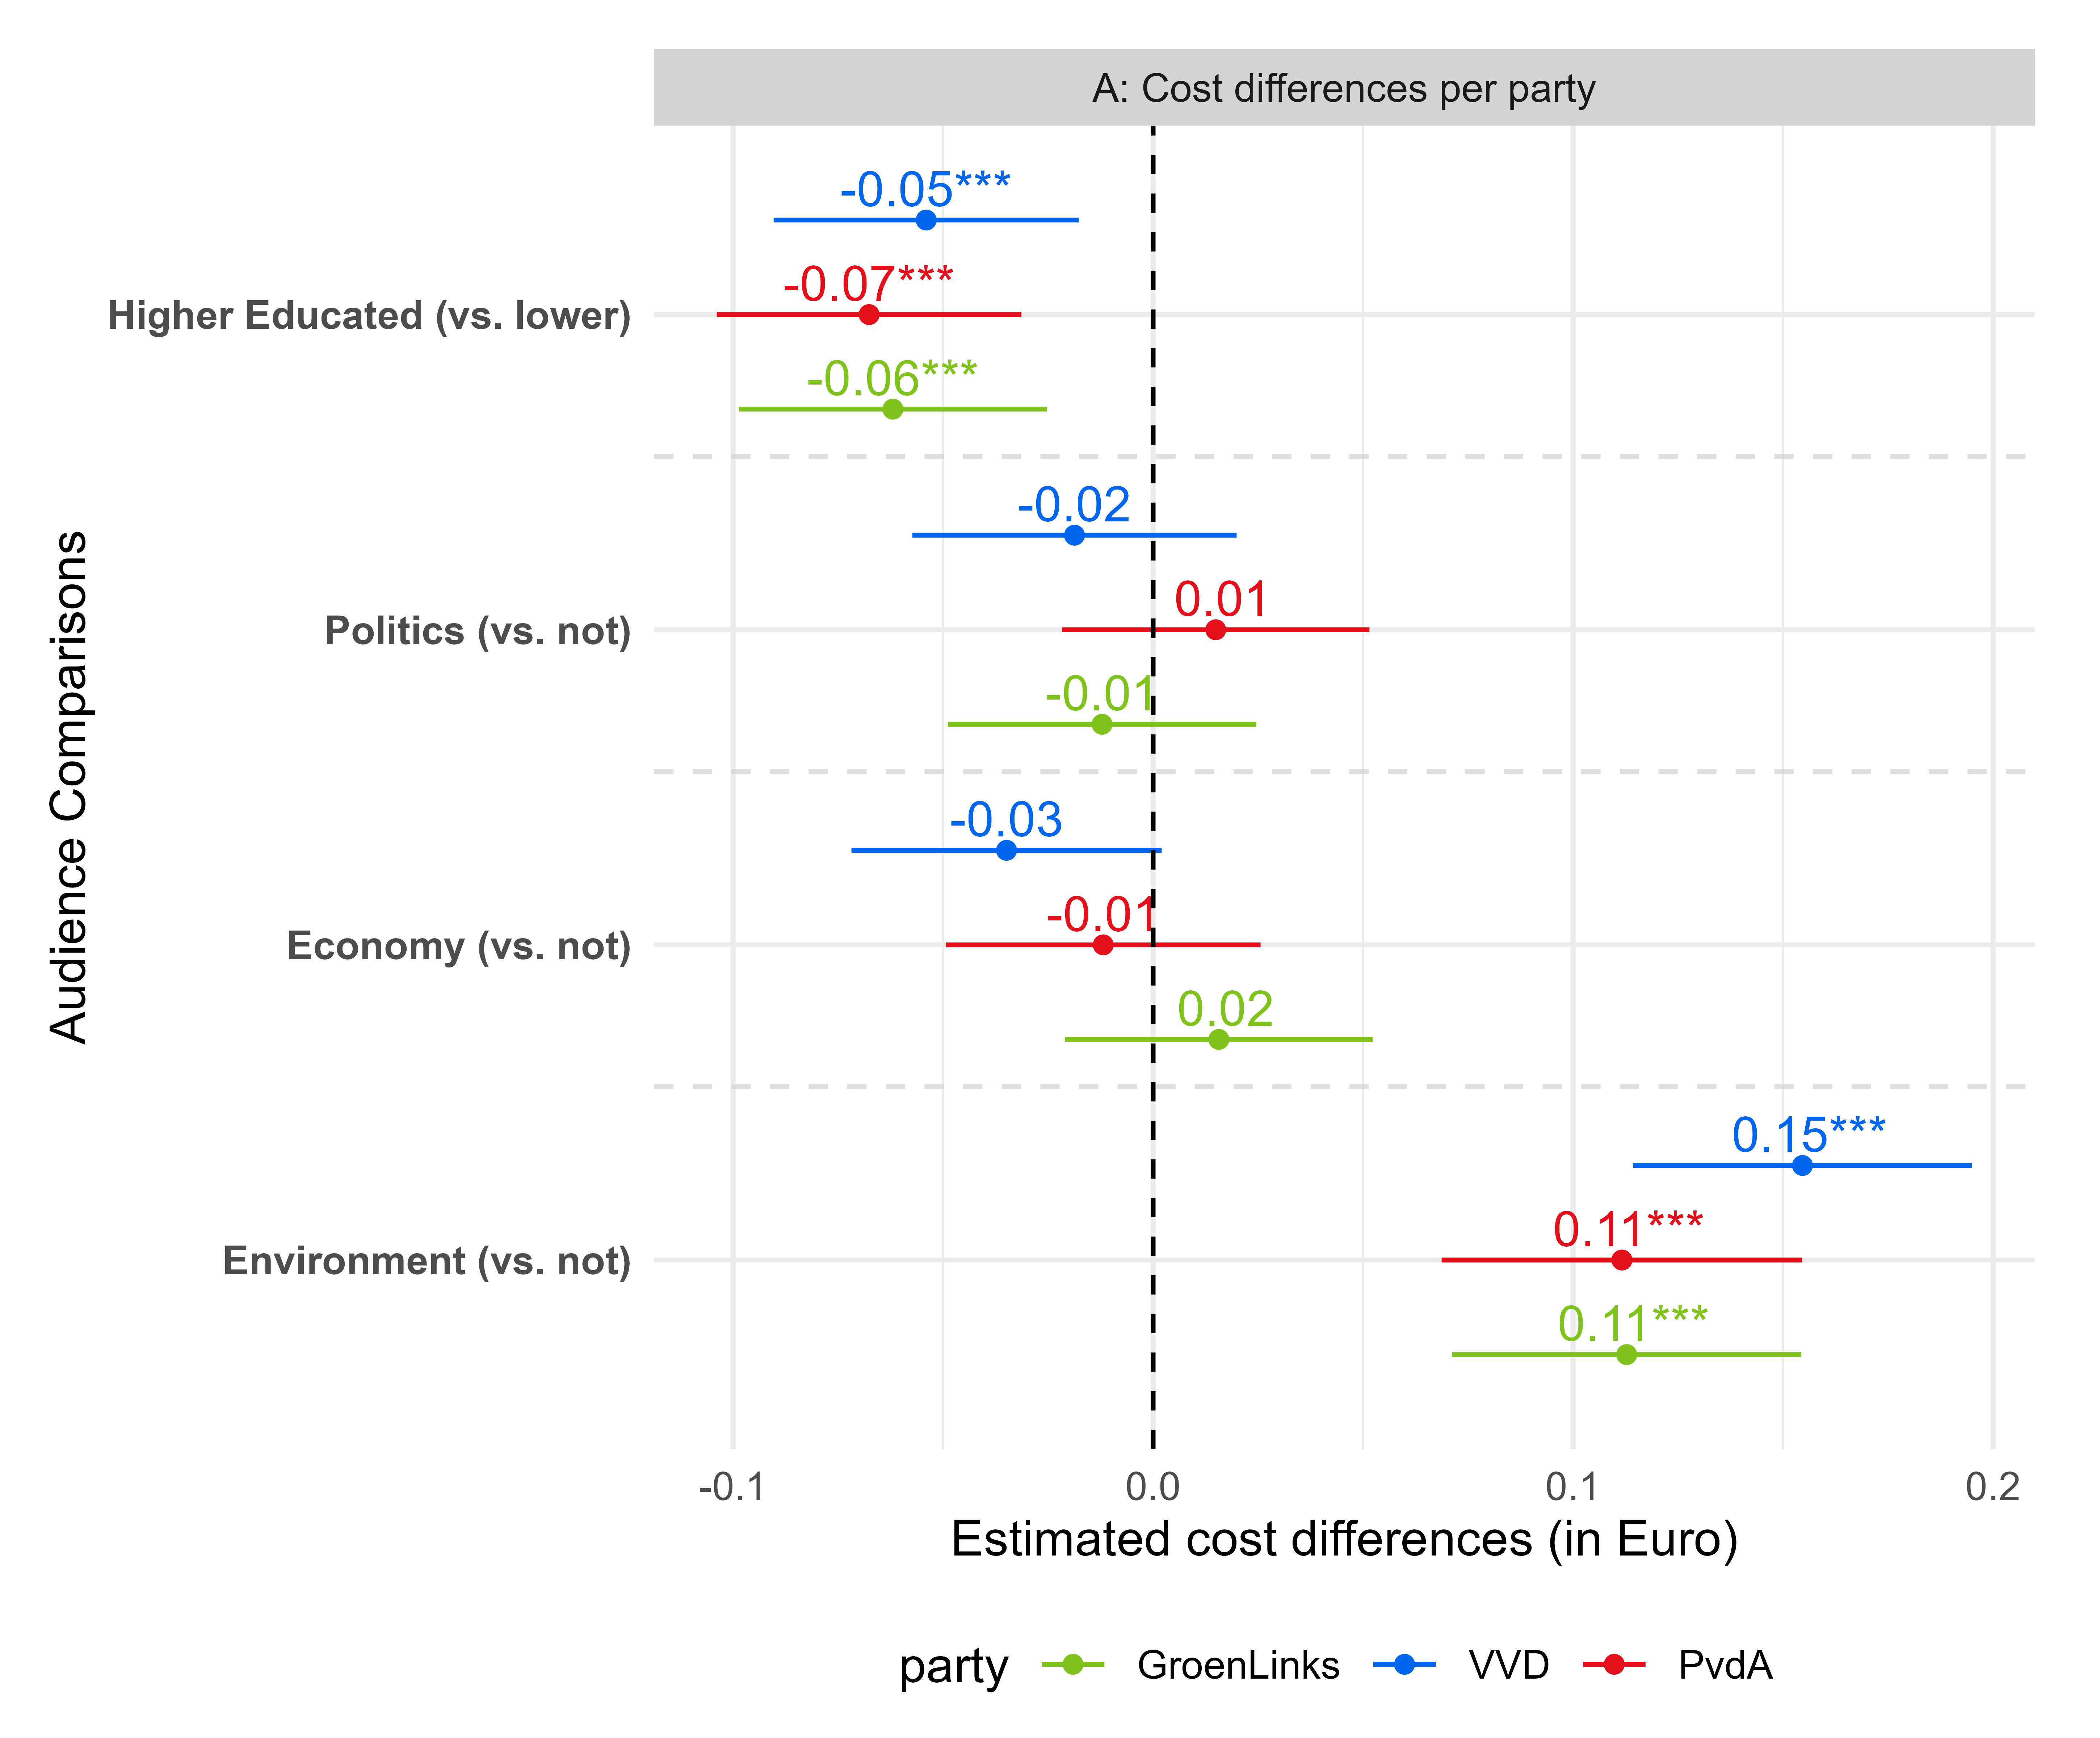 ] --- class: white, middle center **18-24 year olds and women are reached less (and cost more to reach)** 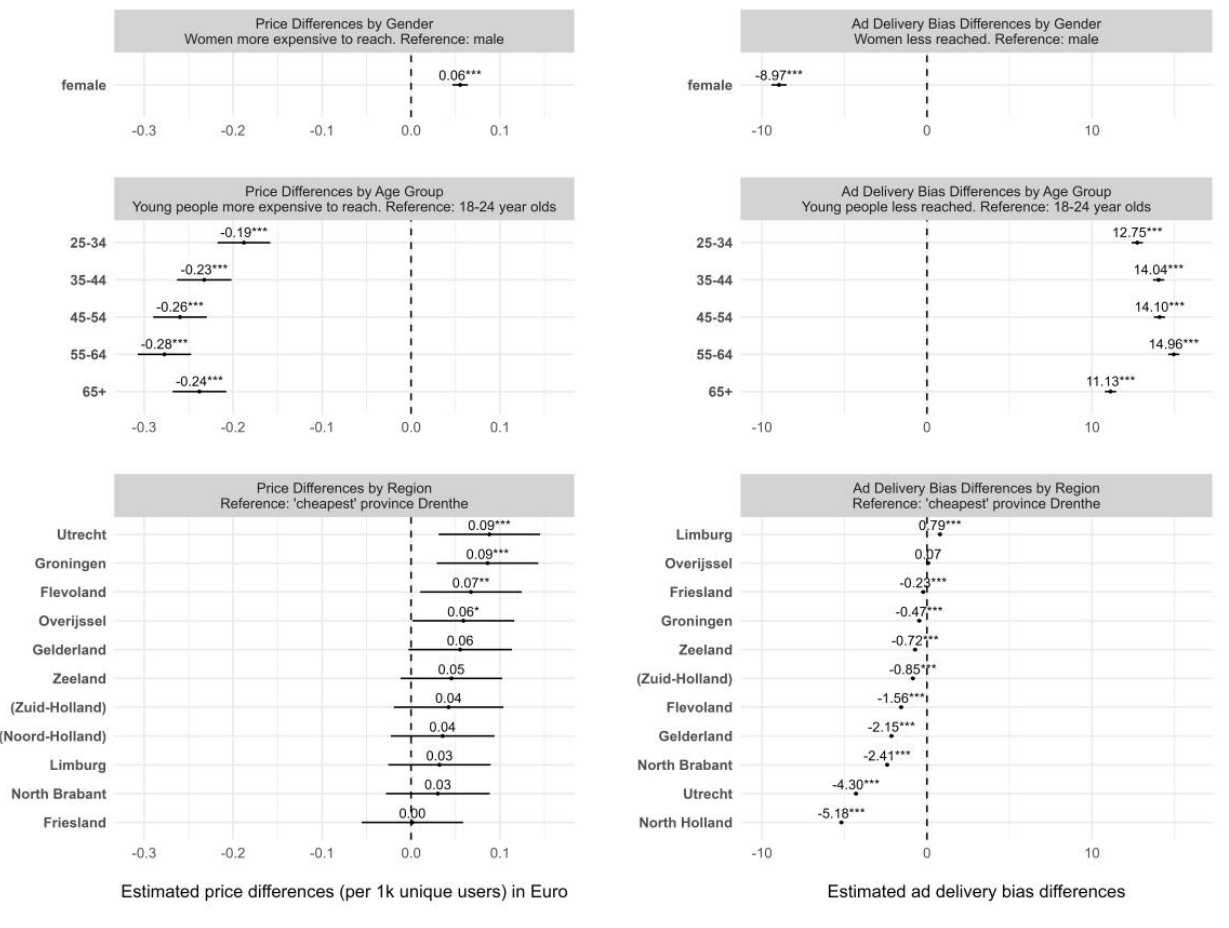 --- class: center, middle ## Summary --- ### Summary Our findings do not always align with expectations. H1: More "relevant" audiences were not always cheaper H2: More "relevant" audiences were not always reached more H3: Party with greatest audience did not reach more or get cheaper prices -- **However:** > We **still** find that Meta ad delivery algorithm prioritizes certain parties and audiences for political advertising 1. PvdA pays least and reach most 2. Lower-educated, people interested in environment, women and younger people more expensive to reach --- ### Implications + Unequal playing field + Meta (dis-)advantages certain parties + the findings presented in this paper show that political parties were not charged the same price for the same service -- + Potential for deepening political, social and geographical inequalities + Some groups of people and regions are **systematically** less likely to receive political advertisements and more expensive to reach + isolating these groups from receiving election-related information -- + Little to no transparency by Meta about these systematic biases + difficult to research and make visible instances of unequal treatment and price discrimination + highlighting importance of access to data -- + Simply "banning" microtargeting would be inadequate + more power to the black box algorithm --- class: center, middle ## Thank you for your attention! Link to presentation: *favstats.github.io/algomicro/epsa2023* .pull-left[     ] .pull-right[     ] --- class: center, middle ## Appendix --- class: center, white, middle ### Within-party differences Reach and cost **over time** -- Potential *market shock* on February 4th? --- class: white ### Within-party differences per day - Reach and Cost .pull-left[ <img src="epsa2023_files/figure-html/unnamed-chunk-8-1.png" width="504" /> ] -- .pull-right[ <img src="epsa2023_files/figure-html/unnamed-chunk-9-1.png" width="504" /> ] --- class: center, white, middle ### Within-party differences Reach and cost **over time** and **per party** `\(\rightarrow\)` party differences remain constant despite *"shock"* --- class: white ## Price differences per day .pull-left[ We observe: *Consistent results* + "Market shock" **hits all parties equally** + Environment audience consistently *more expensive* + Higher educated audience consistently *less expensive* *Inconsistent results* + Audiences interested in economy & politics are typically cheaper except on the day of the spike ] .pull-right[ <img src="epsa2023_files/figure-html/unnamed-chunk-10-1.png" width="576" /> ] <!-- --- --> <!-- ## Summary of within-party differences --> <!-- -- --> <!-- + Some audiences **systematically more expensive** and **receive less ads** than others --> <!-- + Lower Education, Environment interests --> <!-- + No targeting is cheapest, reaches most --> <!-- + Mostly **consistent for each party** --> <!-- + Suspected *"market shock"* on February 4th affects results --> <!-- + Some evidence that politics and economy audiences might be cheaper were it not for the spike --> --- class: white ### Price differences per day <center> <img src="img/days_breakdown_fin.png" width="50%" height="50%"> </center> --- class: white ### Bulk Discount? .pull-left[ <img src="epsa2023_files/figure-html/unnamed-chunk-12-1.png" width="504" /> ] .pull-right[ <img src="epsa2023_files/figure-html/unnamed-chunk-13-1.png" width="504" /> ] --- class: white, middle center ## Skewed delivery in terms of gender, age and region --- class: white ## Differences in delivery by gender .pull-left[ + *Line at zero* shows empirical equilibrium of target audiences (i.e. the observed share of men and women in target audience) + *Deviation from zero* are algorithmic biases + above zero: prioritization + below zero: de-prioritization + Ads *deliver to more men* for every party + However: bias towards men seems smaller for GroenLinks ] .pull-right[ <img src="epsa2023_files/figure-html/unnamed-chunk-14-1.png" width="504" /> ] --- class: white ## Differences in delivery by age group .pull-left[ + Ads *deliver less to young people* + aged 18-24 + Consistent for each party ] -- .pull-right[ <img src="epsa2023_files/figure-html/unnamed-chunk-15-1.png" width="504" /> ] --- class: white ## Region differences -- .pull-left[ + Ads deliver more to some regions + for example: Limburg, Friesland, Drenthe + Ads deliver less to other regions + Utrecht, North Holland, North Brabant + Consistent for each party ] -- .pull-right[ <img src="epsa2023_files/figure-html/unnamed-chunk-16-1.png" width="504" /> ] --- class: white #### Between-party differences .font80[If we exclude economic interests/target environmental interests: VVD reaches less people and cheaper than GL] .pull-left[ <img src="epsa2023_files/figure-html/unnamed-chunk-17-1.png" width="504" /> ] .pull-right[ <img src="epsa2023_files/figure-html/unnamed-chunk-19-1.png" width="504" /> ]